We have moved to a better location, across the street:

Sharing Sage Intelligence Reports in the Cloud>>
February 23, 2014Providex Documentation for Sage 100
February 2, 2014Our team has found the Providex database hard to build solutions with. Sage has built the UQE for use in Sage Intelligence to overcome limitations like multiple left joins but important features like sub-queries are still not supported.
Hit the image below for access to some documentation on Providex:

Creative BI: Consolidated Financial Reporting
January 30, 2014Consolidated Financial Reporting using Sage Intelligence. Also applies to non Financial Reporting….

Consolidated Financial Reporting
Creative BI: Multi-Year Trending on Profit & Loss
January 18, 2014Due to reasons like convention, technical limitations or just an embrace of statutory financial reporting doubling up as management reporting, profit and loss reports often report on activity for the current and previous years only.
I know that for a start-up or a company that experiences a high degree of change, assessing trends over multiple years is not necessarily helpful to managing the business. But there are many companies who would benefit from having a Profit and Loss Statement for many years to assess trends in incomes and expenses.
By creatively applying Business Intelligence, we encourage BI professionals to give customers that option and we encourage companies to insist on multi-year Profit and Loss solutions. Below is a basic example of such a solution, accompanied by a graphical representation of the trend.

Creative BI: Manufacturing Requirement Planning
January 4, 2014Many of our manufacturing customers use Builds of Materials in their ERP to aid in the manufacturing process: configuring recipes, managing inputs, planning for requirement and managing projected profits.
Although these are very useful for a manufacturing environment, for a system to truly be useful to its owner, it must incorporate business information from Sales Orders, Purchase Orders, Component QOH and Unfinished Builds. And finally, what the business manager cares most about is the delivery of this information on an interactive reporting platform.
In this article I wish to share the concept of reporting on shared components between Builds….
One of our customers recently requested that we add the 2 fields below with the red borders to the ‘BOM Requirements Planning’ solution that we had built for them. I thought this was a great idea due to the following considerations…..
When planning requirements in a manufacturing environment, it often happens that component items are assessed and ordered in the context of a particular Assembly. As an example, if Assembly A and B each require 10 components of item Y and both A and B need to be built, then in the context of A and B alone, only 10 of item Y are required when the reality is that 20 of item Y are required.
Hence, the field below named ‘OrderQtyAll’ is one that discloses the total number of components required, including those that are required for builds other than the current build being reported on and analyzed. Consequently the field named ‘RequiredAll’ now reflects the true quantity required by considering QOH, All component items indirectly on order across all builds, Sales Orders and Purchase Orders.

Working Capital Cashflow Model (Pastel Partner)
December 3, 2013
Solution Description
The Working Capital Cashflow Model reveals relevant cash related information relating to Working Capital components. It answers the question that business managers ask with high frequency: ‘how much money will there be in the bank account during and after the current working capital cycle’.
It does this by asking the business manager ‘how many days would you like to forecast cashflows for?’
The model then reveals the Accounts Receivable and Accounts Payable due over the prediction period.
It also predicts other cash outflows incl. Payroll, based on cash outflow activity from the previous month for the same period.
By having this predictive cash information real-time and in one place, you can now take corrective actions by collecting debts with precision,
renegotiate vendor terms and identify other cash outflows that may not be required this month or may not be required at all.
It’s the working capital cashflow model that you dreamed about but have never had the luxury of possessing….until now.
Download this solution here > >
Supported Versions
Microsoft® Excel® 2007+
Pastel v11+

Price List Report (Pastel Partner)
October 28, 2013
Solution Description
The ‘Price List’ solution reveals the 10 Price Lists available in Sage Pastel, with a comparison to the current cost of each inventory item.
On one page it answers some important questions relating to expected profit on inventory items:
‘At a glance, do my price lists look accurate with regard to my current pricing strategy?’
‘Do my price lists exceed the value of the current item cost?’
‘Are any of the price lists redundant?’
Isolate individual Inventory Groups or Stores to apply these business questions to.
The model also calculates the percentage markup for each inventory item on ‘Price List 1’, affording you the opportunity to have exception reporting on inventory which are projected to have poor markups or unrealistic high markups.
Use basic pivot table skills to add your own calculated fields to this report for customized analysis. From here on out, embrace this tool to manage your price lists so that you manage your profits
Download this solution here > >
Supported Versions
Microsoft® Excel® 2007+
Pastel v11+

Profit and Loss Report (Pastel Partner)
October 24, 2013
Solution Description
This Profit & Loss report reveal financial performance information of the company across multiple fiscal years
It answers questions like:
‘How much profit did the company make for a given period of operation?’
‘What is the contribution of Gross Margin to fixed costs’
‘What percentage of revenue does each expense line constitute?’
…..and consequently, where can adjustments be made to increase profits
This solution reports Profit and Loss activity over as many years as have been transacted in Sage Pastel and is not limited to 2 years like the standard Sage Pastel reports
This model groups the report into categories that match your business structure.
It does this by using the Financial Categories, Report Writer Category, External Link Field and Entry Types, all of which are customisable by the user of Sage Pastel.
Download this solution here >>
Supported Versions
Microsoft® Excel® 2007+
Pastel v11+

Consolidated Financial Reporting Video
February 17, 2012So many users of Sage products ask us what options are available to them for Consolidated Financial Reporting. Whether you have an existing set of reports that you would like to convert and improve, like FRX for MAS90/200/500 or Financial Reporter for Accpac, etc. or if you just want to have a set of reports matching your wild imagination, this video should give you an idea of what is possible using Sage Business Intelligence.

Intelligence
Salesperson Commission Summary/Detail MAS90/200
January 16, 2012APPLICATION
This solution is used to rapidly calculate the commission due with a breakdown of commission amounts by Line Item Detail to each member of your sales force. Commissions are calculated when customers are invoiced.
All of these variants contain common dynamic features:
· Swiftly filtering by Sales Person and Customer Numbers.
· Options for a summary and detailed view of fields
SOLUTION FEATURES
This solution has two performance variants:
1) Full report with Invoices dates up to 15 day prior to the current system date.
2) Full report with a Beginning/Ending Invoice date entered at run time.
Solution Free variant available here.
Excel Version: 2007+


Customer Profiling – Simply Accounting 2011 Report
December 7, 2011APPLICATION
This solution provides business information for the profiling of Customers. Use the dimensions in this report to profile customers by Sales and ‘Days to Pay’ for any period.
SOLUTION FEATURES
Depending on the report variant selected, this report provides rapid access to sales-side information and filtering by ‘Customer’, ‘Invoice Number’, ‘Payment’, ‘Paid/Unpaid Invoices’, aging of AR into ‘Current’, ’30 Days’, ’60 Days’, ’90 Days’, ’90 Days Plus’, with the option to isolate aging that is Project related or Non-Project related. This report displays all AR transactions up to the aging ‘cut-off’ date selected at run-time.
This solution has two performance variants:
V1.0 Customer Profiling including Invoice value, Maximum days to pay, Minimum days to pay and Average days to pay. This Free variant is limited to invoices created over the past 60 days.
V1.1 Customer Profiling including Invoice value, Maximum days to pay, Minimum days to pay and Average days to pay.
All of these variants contain common dynamic features:
- Swiftly and easily filter by available reporting dimensions
- User selection of the date range for reporting and a second level filter by document date
- Two views available – Customer and Invoice view
- Drill-Down from Customer to Invoice level
Note: This solution focuses only on fully paid invoices
All Free Variants available here.
Versions: Excel 2007 +


Accounts Payable by Project – Accpac v5.6
December 6, 2011APPLICATION
This solution is used to rapidly view and filter Accounts Payable by Contract, Project and Category for the purpose Controlling cash flow for projects.
SOLUTION FEATURES
This solution displays the Invoice value and amount due against each Invoice, with the ability to drill down to or add the Purchase Order number and amount to the report.
This solution has two performance variants:
V1.0 Contract, Project and Category with Invoice Date, Invoice Amount and Amount Due. This Free variant is limited to Invoices created over the past 30 days.
V1.1 Contract, Project and Category with Invoice Date, Invoice Amount and Amount Due.
All of these variants contain common dynamic features:
- Swiftly and easily filter by available reporting dimensions
- User selection of the date range for reporting and a second level filter by document date
- Access to Purchase Order Number and Amount – Drill-Down to or add to the report
All Free Variants available here.
Versions: Excel 2007 +


Intelligence Store – Inventory of Solutions in Store
December 5, 2011Inventory of Solutions found in the Intelligence Store are as per groups below:
(Click to download copy)
………….find these solutions @

Commission due on Paid Invoices – Sage Peachtree
December 5, 2011APPLICATION This solution is used to rapidly calculate the commission due to each member of your sales force. Commissions are calculated based on paid invoices and therefore suits businesses taking a more conservative approach to paying commissions.
SOLUTION FEATURES
This solution has three performance variants:
V1.0 Amount due with values against each Invoice, Customer and Salesperson, Total Amount for Paid and Unpaid Invoices and Days to Pay (limited to invoices paid for the past 15 days)
V1.1 A total amount due to each SalesPerson
V1.2 Amount due with values against each Invoice, Customer and Salesperson, Total Amount for Paid and Unpaid Invoices and Days to Pay
All of these variants contain common dynamic features
- The option for using a UDF in Sage Peachtree to store and retrieve SalesPerson Commisions
- Swiftly adding and removing report dimensions such as Customer and SalesPerson and
- Swiftly filtering by SalesPerson and Customer
All free variants available here.
Available in: Excel 2007 +


Invoice Register with Amount Due – Mas90/200
November 22, 2011APPLICATION
This solution is used to rapidly view and filter invoices for the purpose of credit control and general efficiency in the office management of the sales cycle.
SOLUTION FEATURES
Depending on the report variant selected, this report provides rapid access to sales-side information and filtering by ‘Customer No & Name’, ‘Invoice Number’, ‘Salesperson No’, ‘Invoice/Transaction Date’, ‘Check No’, ‘Transaction Type’, and ‘Invoice Date & Invoice Due Date’ Less than/Greater than 30 days.
This solution has four performance variants:
1) Complete report (Limited to 30 days prior to current system date).
2) Fields included: Customer Name, Invoice No, Invoice/Transaction Date, & Invoice Balance.
3) Fields included: Customer ID & Name, Invoice No, Invoice/Transaction Date, Transaction Type & Invoice Balance.
4) Fields included: Customer ID & Name, Invoice No, Invoice/Transaction Date, Transaction Type & Invoice Balance. Filtering by Invoice Date and/or Invoice Due Date- Less than/Greater than 30 days.
All of these variants contain common dynamic features:
· Swiftly adding and removing report dimensions such as Invoice Date & Invoice Due Date aging.
· Invoice Cut Off date to filter Transactions.
Free variant available here.
Platform: Mas90/200
Excel versions: 2007+


Inventory Ordering Tool – Sage Pastel
November 20, 2011APPLICATION
This solution is used to make quick, effective inventory ordering and replenishment decisions. Current SalesOrder, PurchaseOrder, and QuantityonHand are factored in with Minimum Order Quantities as well as Inventory Turns based on a user-defined number of periods. Even Inventory Turnover Qty, along with Minimum OnHand and Preferred Supplier are displayed. This handy tool makes Inventory Management a streamlined and efficient task for the purchasing manager.
SOLUTION FEATURES
This solution has three performance variants:
V1.0 Recommended Order Quantity, which considers stock necessary to fill orders as well as factoring in Supplier Discounts by satisfying minimum order quantities. All necessary and current inventory statistics are present for the 1st 30 items setup in your inventory module
V1.1 Recommended Order Quantity, which considers stock necessary to fill orders as well as factoring in Supplier Discounts by satisfying minimum order quantities, Purchase Orders and Sales Orders.
V.1.2 Recommended Order Quantity, which considers stock necessary to fill orders as well as factoring in Supplier Discounts by satisfying minimum order quantities. Taking Sales Orders, Purchase Orders, Avg Sales Qty over a user-defined date range, Stock on Hand and Minimum Levels into consideration.
All of these variants contain common dynamic features:
• Items, with Description and Preferred Supplier grouped by Item Type
• Current Stock Level details including QOH, QOPO, QOSO
• Quick Glance at Required Stock and off you go to place a Purchase Order and satisfy all open Sales orders
All variants available here.
Platform: Pastel Partner
Excel Version: 2007+


Accpac V5.6- Asset Register for ‘Norming Fixed Assets’
November 18, 2011APPLICATION
Using this report will give you rapid visibility of all Assets and salient Asset related information for the improved management of Assets and serves as a basis for statutory Fixed Asset reporting.
ROI AREA
Improved management of Assets
SOLUTION FEATURES
This solution has two performance variants:
V1.0 Displays a register of all Assets by Location and Asset Group, Status, Acquisition Date and the values for Original Cost, Accumulated Depreciation and Net Book Value. Two Additional views of the report are included – 1) a list of Assets by Acquisition Date 2)a list of Assets by Disposal Date (This is a free variant and displays all Project Budgets but only transactions for the past 30 days)
V1.1 Displays a register of all Assets by Location and Asset Group, Status, Acquisition Date and the values for Original Cost, Accumulated Depreciation and Net Book Value. Two Additional views of the report are included – 1) a list of Assets by Acquisition Date 2)a list of Assets by Disposal Date.
This solution contains the following useful features to achieve your goal of rapid PJC P&L interrogation:
1) Easily filter the report by Location and Asset Group, Status, Acquisition Date to isolate Assets of interest for a particular application
2) Swiftly adding and removing report dimensions
3) Using this report in MS Excel as a basis for statutory or other management reporting
Variants available here.
Platform: Accpac V5.6
Excel Version: 2007 +


Applying filters to a Pivot Table – Excel 2007+
August 8, 2011This blog post provides readers with a basic introduction to a pivot table and using the field list and filtering features in pivot tables.
A pivot table is an Excel object which is embedded within an Excel worksheet and affords the user the opportunity to use the mouse to move and filter fields from the underlying data source in a very quick and easy way. Below is an image of a typical pivot table, in this case a list of customers with associated information. This post assumes that you have been presented with a pre-built pivot table and are interested in augmenting it.
The field list contains a list of fields available in the data set that the pivot table is based on. The ‘Pivot Table Tools’ tab becomes active in the ribbon when the pivot table is selected and in the sub-tab ‘Options’, the ‘Field list’ button toggles the visibility of the field list. Once this list is visible, the fields in this list can be used in the pivot table by simply selecting the checkbox beside each field or dragging the field into the appropriate section.

The image below provides a closer look at the field list toggle button and field list.

Each field in the pivot table exposes a filter button which allows basic checkbox filtering.

The filter button exposed by a field also provides more advanced filtering options. The example below filters the report by all phone numbers beginning with ‘*604*’.

By selecting the filter on the first field in the row section of the pivot table, the report can be filtered by any of the value fields. In this example the report is filtered to display only customers having a last sale exceeding $23,000.

Hopefully this introduction to using pivot tables provides you with a starting point to apply your creativity to interrogating and augmenting your Sage Intelligence reports.
Need Immediate access to business reports?
July 8, 2011The Intelligence Store was built in response to our customers requiring immediate access to reports.
It may have exactly what you need: http://theintelligencestore.com/
Can I import a report into any Sage Intelligence environment
June 30, 2011There are different rules for the licensing required across Sage platforms for permitting the import of reports and the following rules apply to each platform:
- Sage Simply Accounting: Any Sage Intelligence license structure will permit the import of reports
- Sage Peachtree: Any Sage Intelligence license structure will permit the import of reports
- Sage Accpac: At least 2 Report Managers OR 1 Connector License is required to permit the importing of reports
- Sage MAS90/200: At least 2 Report Managers OR 1 Connector License is required to permit the importing of reports
- Sage MAS500: At least 2 Report Managers OR 1 Connector License is required to permit the importing of reports
What do I need to be able to use the reports in the Intelligence Store?
June 30, 2011All the reports in the IntelligenceStore are used with Sage Intelligence which is the reporting product of choice, shipped with all the Sage Accounting platforms listed in the IntelligenceStore. After purchasing a report from the IntelligenceStore, you simply import the report into Sage Intelligence and begin using it.
Sage Intelligence reports generate into an Excel template and MS Excel is therefore a prerequisite to using Sage Intelligence. For all the reports in the IntelligenceStore, except where otherwise noted, Excel 2007 or higher is required.
Another tool that does no harm when using Sage Intelligence is good Excel skills. These are not a prerequisite for using reports in the IntelligenceStore but with good Excel skills you can easily improve reports that you download.
Changing/Adding a Calculated field to a Pivot Table
June 30, 2011We created this post to assist our customers who have acquired reports that use calculated fields that may require different inputs based on the options available. At least two of the reports in our IntelligenceStore that may require this skill are the ‘Customer Rebate’ and ‘Commission on Sales/Receipts’ reports.
By way of example, the ‘Commision on Sales’ report for Simply Accounting provides the user the option of using any of the 5 available fields in the ‘Additional Info’ tab in the Employee Records screen to host the commission percentage for a salesperson. Depending on which field is used, the calculated field in the pivot table may have to change to match the field used.
Below is an example of changing the default ‘field 1’ in the calculated field to ‘field 2’. Remember that these fields represent any one of the 5 fields hosted in the screen below in Simply Accounting.

1) Once you have run the report, select the pivot table in Excel and select the Fileds, Items & Sets button and select Calculated Field

2) Now select CommissionDue or CommissionDueCustLevl, depending on where your Saleperson is hosted in Simply Accounting

3) Now change the fomula in the calculated field to draw from any of the other 4 fields available; in this case, the 2nd field

Your pivot table will draw the salesperson commission from the 2nd field in the ‘Additional Info’ tab in the employee records
Sales Trend by Customer
June 24, 2011For a graphical representation of the sales performance of each customer for this year and last, this report offer good value for customer profiling. This report is available gratis in the IntelligenceStore.

SSAI – Amount Due By Customer with Project Flag
June 9, 2011If cash management is a focus in managing your operations then this solution may interest you. The ROI that can be gained from using this lies in saving time in isolating particular customers and groups of customers and viewing these in Summary and in Detail.
And for those managers using Projects in Simply Accounting with the need to apply cash management at project level, the Invoices relating to Projects are cleary identified. This report is available for download in the IntelligenceStore.
Customer Rebate Calculator
May 28, 2011If you have a Rebate program for your customers, this report provides an instant calculation of those rebates due. It can be configured to calculate simple rebates or rebates based on a complex matrix of parameters.
This report is available for download in the IntelligenceStore.

SSAI Solution Examples for Simply Accounting
May 28, 2011Below are some examples of Solutions built using Sage Simply Accounting Intelligence; many of these reports are available for download in the IntelligenceStore.
- Cost Allocation to Projects, including Purchase Orders
- Agile Project Budgeting
- Customer Rebate Calculation
- Salesperson Commission Calculation (based on sales)
- Salesperson Commission Calculation (based on receipts)
- Multi-Company Consolidation
- Dashboard for Companies not using Inventory
- Quotes and Sales Orders by City
- Inventory Order Tool
- Amount Due By Customer w/Project flag
Importing a Report into Sage Intelligence
April 22, 2011Below is a step-by-step procedure for importing a report into Sage Intelligence:

Simply Accounting Intelligence – Standard Project Download
April 22, 2011Sage has released a standard Project Report for Simply Accounting Intelligence. Just click the image below to download the report and then import it into Simply Accounting Intelligence. Also, take a walk throught the Intelligence Store for more Simply SSAI solution: http://theintelligencestore.com/

Report Designer, new in Accpac
April 17, 2011The Report Designer which simplifies the creation of Financial Statements using SAI, has been available for MAS users for some time and is imminently available to users of SAI in the Accpac environment too. In summary, it provides a user-friendly Excel interface to create and modify Financial Reports.
For those consultants who prefer to be prepared for new technology, have a gander at these videos: http://community.alchemex.com/group/excelgeniereportdesigner

Consultant Clock
April 16, 2011I apologize for referring to the same article in two consecutive blog posts but I feel compelled to share this for the benefit of of consultants and their customers.
Ed Kless wrote an article containing a link to the Lawyer Clock which is shocking reminder to me of how the business habits that we acquire over time can become counter-intuitive our stated business objectives. For instance, managers, customers, consultants seem to love to call meetings, and my objection is that 1) very seldom are the objectives of meetings well defined, communicated and followed up on and 2) very seldom does our internal dialog ask the question ‘all things considered, is this the very best use of ‘me’?’
Now I know that in the comment above I might have strayed from the obvious message of the lawyer clock – that the billable hour creates very little value for the customer – and in response to the obvious message, I have witnessed 3 recurring approaches to meetings with customers:
1) bill per hour and provide some specialized information to the customer during this session
2) the customer is not billed for the session because the consultant does not believe that her time is valuable unless focused on a technical set of tasks; this approach does nobody any favors because the consultant’s subconscious mind is nagging to get back to some billable tasks and therefore prevents any meaningful engagement
3) the customer’s needs are fully embraced by the consultant and the output of the meeting is a centralized record of the customers needs and the recommended approach to a solution; the customer owns this record and the investment in this record is a predictable amount from the start.
It is times like these when I am so grateful for the free market that permits us to choose the approach that produces maximum shared value…….the choice for me is obvious.
Selling a Return on Investment
April 15, 2011I often remind my team: ‘if we are not selling a ROI for the benefit of our customers, then we are in the wrong business’
Every solution should be birthed in ROI. When a customer approaches us for a Business Intelligence solution and they say ‘I need a report’, the subtitles that I read are ‘I have identified an area in my business that would benefit from automation; I need rapid access to customized information to make profit driving decisions; word on the street is that you can make this happen for me and within a reasonable period of time, I would like to see a ROI’
So Financial Managers will teach us that they use NPV or IRR to calculate an acceptable projected ROI for capital investments. In doing so, the confidence and peace of mind of management with respect to the project is directly proportionate to the trustworthiness on the inputs, viz a vie, total cash outflow for the project. In the Accounting / Business Intelligence Solutions space, companies employ consultants to get the job done.
But getting the job done may have different meanings to the customer than they do to the consultant. Many times the consultant believes that the customer will be impressed by all the technical skills brought to the project but in fact the customer wants to assurance that the outcomes be fully understood and that the solution is delivered within the project constraints and contains all the features that will ensure a the expected ROI. One of the unspoken expectations that I believe customers have of consultants is that they buy into the ultimate objective of a target ROI and that this guide the sections within the project. So, if this is true, then as consultants it is important to understand that part of what we are being employed to do is to mitigate the downside risk of our customers underestimating the true cost of projects.
And for those consultants who believe that this forms part of their responsibility to the customer, you know all to well that you are now compelled to abandon any of these phrases: 1) ‘let’s see how the project goes and in the meantime we will just bill you for the time spent’ 2) ‘We do not fully understand the desired outcome but I estimate this solution to cost $x’ 3) ‘we should give you a software demo asap’ 4) ‘we will order the software so long and concurrently assess what it is you really need’ 5) ‘I estimate the solution to cost $x but will bill you for actual hours spent’
As a customer, what I want to hear is ‘Mr. Customer, we appreciate your trust in our abilities; we want to fully understand your desired solution and how exactly it will benefit your organization; once we understand this, we intend to commit ourselves to that end by providing a solution and recommendations based on our expertise in this field; all investments into this solution will be quantified by us and communicated to you after gaining a common understanding of the desired solution and before building the solution.’
I found an article written by Ed Kless referring to a Sage business partner (Aries Technology Group) who to date I have not yet had the honor of working with. This article and associated video summarizes a few of the concepts above very well.
Project Intelligence – Sage Simply Accounting
March 27, 2011Project Management Objectives
The business manager within us will tend to leap to ‘Profit’ as the main objective of each project and in the short term, what a noble goal. Those having a more sustainable view, let’s call them the ‘altruistic entrepreneurs’ might define the objective as ‘maximizing the business value that each project delivers to our customers’. When the project falls on the lap of the project manager, the definition generally changes to ‘deliver exactly what we promised and close the project’.
All of these functions, however, share the same tactical focus about active projects, being ‘what is the actual vs budgeted profit’. The answer to this question includes parameters like ‘percentage completion’, ‘projected markups’, ‘available resources’, but the scope of this article is limited to Project Budgeting and Forecasting using SSAI.
Project Management Options
One of the dilemmas facing project managers is finding the balance between predictability of resource allocation and flexibility in responding to changing project outputs (outputs normally change in response to newly available information).
Traditionally, in more physical project environments with easily defined outcomes, sequential tasks and milestones were planned up front, projects had a very long planning horizon and predictability was one of the benefits obtained. Project managers refer to this sequential, predictable style of project management as a ‘waterfall’ model. The planning philosophy here is: plan, design, build.
In recent times, a brand of project management called ‘agile’ management has surfaced in response to the need for creativity injection, rapidly changing customer needs / technological advances during the project and complete, releasable phases within the project that have very short time horizons. The planning philosophy here is: envision, explore, refine.
An advantage of the waterfall model is the ability to create a budget for a long time horizon and an advantage of the agile approach is responsiveness to change.
How does SSAI compliment both models from an ‘actual vs budget’ point of view?
There are two broad approaches to this solution, both exposing the flexibility that characterizes SSAI. The first two solutions serve the ‘waterfall model’ and the third solution serves the ‘agile model’. All three solutions aim to assist management in monitoring project expenses and profits.
1) Total Actual vs Budget per Project – Waterfall Model
This BI solution is a standard solution which ships with SSAI and exposes the full functionality of MS Excel for filtering, sorting, expanding and general analysis.

2) Monthly Actual vs Budget per Project – Waterfall Model
Recognized revenues and expenses are compared to budgeted figures to provide variance reporting on request.
3) Monthly Actual vsForecast per Project – Agile Model
This solution provides management with the option to compare the recognized revenue on a project to either the project budget hosted in Simply Accounting or a forecast hosted in SSAI. The forecast in SSAI affords management the opportunity to swiftly change forecast values and execute ‘what-if’ analysis on individual projects or all projects.

Figure 4 below provides a drill-down to a particular project’s resources and their associated budgets / forecasts. Resource budgeting would be done within SSAI and provide tighter control over projects, exposing high and low performing resources.

MAS 90/200/500 Aggregated Financial Report & Report Designer
March 16, 2011Due to SMI producing financial statements at the lowest level of detail by default i.e. GL account level versus an aggregated level, customers with large numbers of GL accounts can sometimes experience slower report running and statement generation times. This is solved by aggregating the data to a higher level before the data arriving in Excel, resulting in enhanced performance.
After you have downloaded these reports, take a walk though the IntelligenceStore for more solutions for download.
The reports as described below can be downloaded and imported in MAS:
Download Aggregated Financial Report
Download Aggregated Financial Report Designer
Download Aggregated Financial Report MAS500
Download Aggregated Financial Report Designer MAS500
These aggregated reports are designed to cater for large volumes of financial accounts by rolling up account balances to a maximum of 2 account number segments – 1 and 2. Segments 3 and onwards will not be pulled into this report.
The Aggregated Financial Reports container Join can be changed to use a different segment. By default it uses the Natural (Main) account plus Segment 2. To change it to use Segment 3 rather make the change as shown below to the Container SQL:-

Aggregated Financials
An example of the performance enhancement to be expected is illustrated below:
Financial Report

Report Designer

Simpy Accounting – Project Allocation & Materials Planning
March 13, 2011Sage Simply Accounting Intelligence provides project managers with the tools to swiftly educate themselves on costs allocated to projects and the Purchase Orders that drove those costs. Below is one of many reporting routes that this tool affords managers of projects, including a snapshot of outstanding Orders on Individual projects or all current projects.
This report is available for download in the IntelligenceStore.
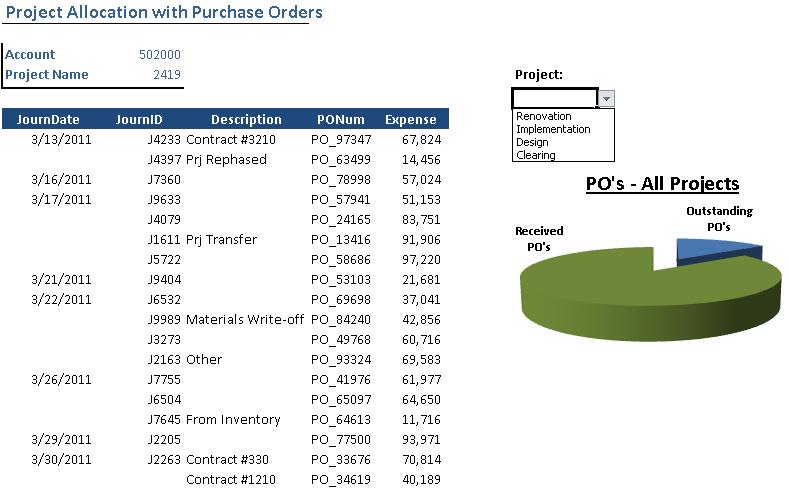
SSAI ProjAllocation
Below is an illustration of the Drill-Down information produced when a specific Purchase Order is interrogated from the report above.

SSAI ProjAllocation DrillDown
I know I say this too often, but how can you afford not to invest in solutions like these?
Craig Juta, Intelligence Consultant
FRx To SMI Conversion In 2 Easy Steps
February 2, 2011This video is intended to provide you with an FRX to SMI conversion approach that achieves your conversion objective as swiftly as possible.
I hope it helps you and good luck!
Intelligence
New Reporting Trees
January 28, 2011I thought I would sharpen your appetite for more Sage Intelligence Reporting muscle. For those consultants familiar with FRX reporting trees, this new feature is said to match and exceed those. For those consultants not familiar with reporting trees, they provide a fast way of slicing GL Accounts into Natural Account and Segments and reporting by ranges on these dimensions.
I am not sure of the ‘to-market’ date yet but this provides an idea of what is to come………

ReportingTrees
FRX / FR Report Migration to Sage Intelligence in 6 Steps
January 23, 2011Migrating existing Financial Reports from FRX and FR (in the case of Accpac) can be done with the help of this video.
In producing this video I found it hard to know how much detail to include and how much to exclude. I think I leaned more toward providing a brief overview of the 6 steps required to do the basic migration and I leave the subsequent creativity required by good BI solutions to you. I hope it helps you…………………
FRX / FR Migration to SAI
STANDARD REPORTS SCREENSHOTS
January 6, 2011Sometimes it just feels right to show your customers a few screen shots of the standard or close to standard report-set that accompanies Sage Intelligence. The workbook below is a free download and it may assist you in these situations.
PROJECT & JOB COSTING INTELLIGENCE
December 12, 2010This report and it’s derivatives provide crucial Project Intelligence to business managers.
It is totally Excel based and uses Sage Intelligence to deliver dynamic data directly from your ERP.
Dynamic Dashboard
November 25, 2010The standard Sage Intelligence Dashboard does not provide time based interactivity and for those business owners/managers who value BI interactivity, have a gander at this very short video on the Dynamic DashBoard:

Report Designer
November 22, 2010The MAS 90, 200 and 500 community have had the luxury of access to the ‘Report Designer’ and the Accpac community will soon possess this luxury too. It is a neat tool that affords the user of Sage Intelligence an interactive reporting experience. I have included a snapshot below and you can expect much more content on this in future blog posts.
USEFUL AUXILARY REPORTS – MAS 500
November 22, 2010These reports just produce datasets and do not contain any logic for Business Intelligence. They have been useful to me in providing BI solutions to MAS 500 Partners and their customers and I hope that they assist you in your BI quest with Sage MAS Intelligence.
As usual, to import a report, the receiving system requires a second Report Manager license and/or a Connector module license. I recommend the following steps for use:
- Click the link above to download the file
- In the Report Manager, right click on an existing folder and select the ‘import report’ menu option
- Browse to the file, select it and choose positive answers to all questions
Good Luck!
THE ‘IF STATEMENT’
November 22, 2010The ‘If Statement’ is often used for basic reporting in Excel. It provides an easy method of assessing the truth of an assertion and then returning one of two values depending on whether the assertion is true or false.
Syntax: IF(logical_test, [value_if_true], [value_if_false])
In this example an ‘If Statement’ tests whether the value ‘MyDate’ is larger or equal to the date above the target cell; the result is either an actual or a budget value depending on the truth of the assertion:

VLOOKUP FOR REPORTING
November 22, 2010The ‘vlookup’ function is often used for basic reporting in Excel. It provides an easy method of returning an associated value from another location based on a ‘lookup value’ common to both locations.
In this example a ‘vlookup’ function returns custom categories to the Income Statement that has been generated through the Sage Intelligence menu; the common ‘lookup value’ in this case is the GL account number:

FINANCIAL REPORTING
November 21, 2010This Financial Reporting and augmented versions thereof are available for all Sage Accounting/ERP products.
Contact Craig to match this tool with your Financial Reporting objectives.
FREQUENTLY ASKED QUESTIONS – SMI
November 15, 2010- SMI is hanging off the MAS menu, as such to access SMI will require an open MAS license, and then to execute the SMI report will require either the Report Manager or the Report Viewer. Is that correct? Yes, for MAS 500 only as it is integrated into the MAS 500 desktop. For MAS 90/200, a MAS user license is not required in order to access SMI
- Report Manager is a named/workstation license, is Report Viewer also a named workstation license? Yes
- As a partner I should have a complete set of tools, manager, designer, connector and a viewer, which I can load for my consultants and for my sales engineers – is that an accurate understanding? Yes, 100%
- The product literature says that auto-generation and distribution of reports is part of the functionality. What modules does that, and how is it configured? Or is it leveraging other tools such as windows scheduler and are we saying distribution is simply attach a report and send via email as opposed to an automatic generation overnight for example and then automatically sending specific reports to specific people based upon some configurations in the application? SMI generates scheduler commands but requires either windows scheduler or SQL scheduler to trigger the reports to run. The ability to generate scheduler commands is locked out in the same way as the import report functionality and is enabled by purchasing an additional report manager license or connector module. SMI has a standard add-in that allows reports to be emailed to a set of email addresses as well as can have output published to HTML for internet/intranet use.
- Is the ‘Report Designer’ free or for sale? For Sale from your Business Partner
- Do all MAS clients receive 4 free Report Managers? MAS 500 customers receive 4 licenses. MAS 90/200 customers receive 1 Report Manager License
- Which modules are a prerequisite for being able to import reports? At least 2 report manager licenses (which means that MAS 500 customers have this feature without acquiring new licenses)
- MAS 500 – Even though multiple companies normally reside in one database, is the Connector required for consolidation? yes
INVENTORY MANAGEMENT
November 15, 2010This tool is available for all Sage Accounting/ERP products and increases the speed and accuracy of Inventory management and reporting.
Contact Craig to match this tool with your inventory management objectives.
DASHBOARD ANALYSIS FOR AR – free download
October 10, 2010For those who have clients without the Operations Suite installed, I know what it feels like to run the Dashboard Analysis Report in Sage Accpac Intelligence and receive that dreaded error message about there being no Order Entry tables. I have amended the standard Dashboard Analysis Report and the output looks like this:

DashboardAR
This report can do with some improvement but at least it gives you the chance to show your clients the dashboard on their data.
To enable such clients to use the dashboard, download the report below and import it into SAI.
As usual, to import a report, the receiving system requires a second Report Manager license and/or a Connector module license. I recommend the following steps for use:
- Click the link above to download the file
- In the Report Manager, right click on an existing folder and select the ‘import report’ menu option
- Browse to the file, select it and choose positive answers to all questions
The report is now ready for use in the folder to which it was imported.
Contact Craig if you wish to include drill-down features for Customers, Items, Account-Sets and GL Accounts.
DYNAMIC DASHBOARD ANALYSIS – available from bxIntelligence
October 7, 2010This question must have been occupying somebodies mind out there at some point: “The SAI dashboard is great for summarizing business activity and driving organizational change but is there a version of this report that allows me to change the YTD figures without re-running the report, or just focus on a particular period’s activities?”
The answer is of course ‘Yes’. Contact Craig at the contact details in this blog to purchase one of the reports below:
1) Reporting from Order Entry – Change the YTD figures without re-running the report or just focus on a particular period’s activities

2) Reporting from Accounts Receivable – Change the YTD figures without re-running the report or just focus on a particular period’s activities

REVENUE_AR REPORT – free download
October 6, 2010For those who have clients without the Operations Suite installed, I know what it feels like to run the Sales Report in Sage Accpac Intelligence and receive that dreaded error message about there being no Order Entry tables. To enable such clients to view sales figures, download the report below and import it into SAI.
An image of the attached report is below:

RevenueAR
As usual, to import a report, the receiving system requires a second Report Manager license and/or a Connector module license. I recommend the following steps for use:
- Click the link above to download the file
- In the Report Manager, right click on an existing folder and select the ‘import report’ menu option
- Browse to the file, select it and choose positive answers to all questions
The report is now ready for use in the folder to which it was imported.
SECURING SAI REPORTS
October 5, 2010MODULE LEVEL SECURITY
Each SAI module that can be launched from the ACCPAC UI will follow the standard ACCPAC Roles, Users and Authorization processes that ACCPAC uses for securing all its other modules. Using the the standard security screens in ACCPAC it will be possible to Allow or Restrict given users (through Roles) from launching the relevant SAI modules.
REPORT LEVEL SECURITY
To provide more granular level security at a report level, an Accpac Intelligence Security Manager is provided that allows users to be granted access to run specific reports only. For this the following rules will apply:-
- Report Level Security at installation will by default be switched off and must be switched on within the Security Manager to take effect
- Only users added to the Administrative role will be allow to Add/Edit/Delete reports within the Report Manager
- The list of Users within Accpac will be synchronised with the list of users in this Security Manager.
How can I secure my Sage Accpac Intelligence reports and modules?MODULE LEVEL SECURITYEach SAI module that can be launched from the ACCPAC UI will follow the standard ACCPAC Roles, Users and Authorization processes that ACCPAC uses for securing all its other modules. Using the the standard security screens in ACCPAC it will be possible to Allow or Restrict given users (through Roles) from launching the relevant SAI modules.REPORT LEVEL SECURITYTo provide more granular level security at a report level, an Accpac Intelligence Security Manager is provided that allows users to be granted access to run specific reports only. For this the following rules will apply:- Report Level Security at installation will by default be switched off and must be switched on within the Security Manager to take effect Only users added to the Administrative role will be allow to Add/Edit/Delete reports within the Report Manager The list of Users within Accpac will be synchronised with the list of users in this Security Manager.
EVALUATING COMPLEX FORMULAS
October 5, 2010We have all received a formula from a colleague trying to be smart and found it difficult to understand the make-up thereof. Excel provides a tool to evaluate the results and make-up of a formula in the form of the ‘evaluate formula’ button in the ‘formulas’ tab in the ribbon. With the cell selected, click the ‘evaluate formula’ button and then click the ‘evaluate..’ button multiple times. Each time it is clicked the next parameter in the formula/function is evaluated.

Evaluate Formula
This is a very useful feature for understanding a complex formulas and for troubleshooting such formulas.
NAMED RANGES
October 5, 2010Named Ranges are an essential part of Excel reporting, among other reasons, for the purpose of making formulas understandable to all users and to keep the workbook neat.
For naming cell/range references, the ‘name box’ can be used to create a named range.
By using the ‘Name Manager’ in the ‘Formulas’ tab a name can also be a placeholder for all of the objects listed in the illustration below.

Names
FORMATTING FOUND VALUES
October 5, 2010It is often useful to format cells based on the content of the value or formula in a cell. By using the ‘find’ feature (ctrl + ‘f’)this can be done very swiftly.
1) Select the area to analyze
2) Hit ctrl + ‘f’ and in the ‘find’ textbox type the value to be found
3) Click the ‘Find All’ button and you will see a list of cell references appearing where the desired value was found
4) Within the list of references select the first and while holding down the ‘shift’ key, select the last reference
5) Now all the cells containing the matching text will be selected

Format Found
6) Close the ‘find and replace’ dialog box and apply a formatting to the selected cells

Format Found
You are now in a position to isolate these cells by using the sort or filter by color features in Excel.
This technique could also be used for finding cell references in formulas for the purposes of formula auditing.
Finding Duplicates
October 5, 2010Since Excel 2007 it has been very easy to find duplicates. There are at least 3 ways to do so with this method being the easiest.
1) Select the data where duplicates are suspected

Finding Duplicates
2) Make the selections as per the illustration above

Finding Duplicates
Excel provides some formatting options for the duplicates found and applies the formatting.
So it is a 2 step process to find duplicates. Once identified you may use the filtering or sorting by color in Excel to isolate the duplicates
FILLING BLANK CELLS WITH THE VALUE OF THE CELL ABOVE
October 5, 2010It is many times the case where my clients inherit data that contains many blank cells and to achieve the transformation to a datalist, much cleaning up is required. One of the most useful arrows in your Excel quiver in this case is the GoTo dialogue box. Where you have dispersed data in one column and would like to fill the blank cells, do the following:
1) Select the area that you would like to fill, including the data

Fill Blanks
2) Hit the ‘F5’ key and click on the ‘special..’ button in the GoTo dialog box
3) Select the ‘blanks’ radio button and click ‘OK’

Fill Blanks
4) You will notice all the blank cells selected and the top selected cell being active
5) Now type ‘=’ and then hit the up arrow once to point the active cell to the cell above it
6) Hold the ctrl button down and hit ‘Enter’ and all the blank cells are now populated
Enjoy this trick as it will save you many painful hours.
RETURNING A VALUE WITHIN A RANGE OF VALUES
October 5, 2010Everyone knows how to return a value from a list where a matching value is found in a corresponding list; we use a vlookup function. Well with 2 tweaks a vlookup can also return a value where the matching value falls within a range of values, like in the case of a tax table or sales commission table.
The following points are critical to the successful use of this technique:
1) If range_lookup parameter (last parameter) is either TRUE or is omitted, an exact or approximate match is returned. If an exact match is not found, the next largest value that is less than lookup_value (first parameter) is returned.
2) If range_lookup is either TRUE or is omitted, the values in the first column of table_array (second parameter) must be placed in ascending sort order; otherwise, vlookup might not return the correct value
SAI v5.6 BUNDLE FUNCTIONALITY
September 29, 2010For those readers who prefer the summarized version, acquiring additional SAI licences affords you the opportunity to 1) fundamentally augment the standard reports or create your own & import reports created off-site (Connector Module) OR 2) import reports created off-site and have multiple SAI users (Report Manager). If you are partial to detail then have fun with the points below.
WHAT IS BEING BUNDLED AS PART OF THE SAGE ACCPAC VERSION 5.6 RELEASE?
Each client will get the Intelligence application, which includes:
• Standard report templates for management (financial reports, dashboard, financial analysis/trends), sales, purchases, inventory and Top five product, customer and vendor KPI reports). Does not include data cubes (requires Analysis module).
• Connection to only one Sage ERP Accpac company database at a time only (although can connect individually to multiple Sage ERP Accpac company databases).
Each client will also receive a single user License for the Intelligence Report Manager, which allows the user to:
• Author new reports (organizing, creating, editing), as well as filter and aggregate data based on existing data containers and available fields only.
• Set permissions/security for both Intelligence modules and/or licenses as well as individual reports.
WHAT LIMITATIONS APPLY TO THE INTELLIGENCE SOLUTION THAT IS BEING BUNDLED AS PART OF THE SAGE ERPACCPAC VERSION 5.6 RELEASE?
• Can connect to any number of Sage ERP Accpac companies but only one company at a time.
• Cannot connect to non Sage ERP Accpac databases (the Connector Module is required to connect to additional ODBC sources).
• Cannot add additional fields to standard reports that are not already provided by the data containers (requires Connector Module).
• Cannot perform multi-company consolidations (requires the Connector Module).
• Cannot create reports off modules and/or fields that are not available in the standard data containers (requires the Connector Module).
• Cannot schedule reports to run automatically (requires the Connector Module).
• Cannot import reports created from other Intelligence installations (requires an additional Report Manager and/or Connector Module).
• Cannot run OLAP or cube reports (requires the Analysis Module).
WHAT IS AVAILABLE FOR SAGE ACCPAC VERSION 5.5?
There is no difference in functionality for Intelligence from Sage ERP Accpac Version 5.5 to Version 5.6. The product is sold the same way, with the exception of the additional value for our customers that move to the current Version 5.6 version (free Report Manager License). Partners can use their Master CD for Version 5.6 to install product for customers that want to remain on Version 5.5. Customer can also order the product for Version 5.5 and they will be shipped a CD.
REPORTING METHODOLOGY OVERVIEW
September 15, 2010I know that this diagram might be intuitive for the readers of this blog….after all, only the smartest audience accesses it. I found it in an article written by the Alchemex team and thought it might be of assistance to those readers with visual preferences. It suggests an approach to thinking through the solution delivery process.

Reporting Methodology
Craig Juta
REPORT CREATION OVERVIEW
September 15, 2010The process of creating a NEW report requires that you use the Sage Accpac Intelligence Connector to create a connection to a data source. The Sage Accpac Intelligence Report Manager is then used to create the report and link it to an Excel template. The following figure summarizes the entire process of creating a report using the Connector and the Report Manager module:


Reporting Overview
- use the Sage Accpac Intelligence Connector to create a connection to a data source
- add a data container which may constitute a table, join, SQL query or existing view
- add expressions (database fields) which are exposed in the container referred to above
- now fire-up the Report Manager and create a folder
- right click the folder and select the option to create a report, linking the report to the container created above
- select a set of expressions (database fields) from those available and sort these as they should appear in the report
- run the report
- make the desired changes to the resulting Excel template
- link this template back to the report for future use
Craig Juta is a SAI and Excel BI expert operating out of Alberta, Canada
TRANSPORTING REPORTS
September 10, 2010Sage Accpac Intelligence supports the ability to create a report in one system (say for example on your business partners installation of SAI), and export this report as an ‘.al_’ file, email to one of your customers, and they can then import this report using the Report Manager or Connector module.
The single FREE Report manager that ships with Accpac 5.6 does not allow reports to be imported and so in order for your customer to be able to benefit from this feature the following options are available:
- invest in at least one more Report Manager license
- invest in a Connector license
Either of these investments enable importing and exporting of reports.
Note: Exportng a report produces an ‘.al_’ file which contains the SQL query, the report structure and also the Excel template linked to that report.
Craig Juta
NEW IN SUMMARY – EXCEL 2010
September 8, 2010The following is a list of features new to Excel 2010 and which will be explored in future blog posts:
- 64-bit version
- Sparkline charts (very groovy)
- Slicer (new tool in Pivot Tables)
- Office button changes including an ‘Office Backstage’ screen
- Conditional formatting enhancements
- Image-editing enhancements
- Screen capture tool (for inserting images)
- Paste Preview (before committing the paste)
- Ribbon customization (after much anticipation)
- Calculation engine efficiencies
- VBA Enhancements
Craig Juta, Excel Trainer
Financial Pack Consolidations – Setup
September 7, 2010Multi-company consolidation is one of the features of SAI that sets it apart from other BI tools and this consolidation is not limited to financial reporting. There are 2 ways to do this – manually setup each company or use the built-in consolidation feature.
To use the built-in consolidation feature, observe the following steps:
- Be sure to have successfully installed and activated the Connector module
- Activate Sage Intelligence in each of the companies that are to be included in the consolidation
- From the Report Manager, select the report named ‘Financial Pack Consolidated’
- Click the button to the right of the ‘Company List’ textbox to expose a list of all the companies having Sage Intelligence activated
- Select all companies required
- You are now ready to run the report and have all the GL accounts from each company available to you in the resulting MS Excel template
Craig Juta, SAI enabler
Financial Pack Consolidations Explained
September 7, 2010Sage Accpac Intelligence has a built in feature that creates the basis for a consolidated set of reports and it provides a way to do this consolidation manually. In both cases the Connector module is required to perform this consolidation – see my blog on the steps to consolidate. The word consolidated is used here to mean that it will return the GL account and balances from multiple databases and place them beneath each other, ready for consolidation.
What the consolidation feature does not do is aggregate the GL account balances for each unique GL account across companies. This would be a task for the person designing and creating the Excel template. There are of course many ways to do this and the quality of this design decision can be measured against the ‘less is more’ principle, including the spreadsheet design best practices included in this blog.
One neat way of doing this is to group all unique GL accounts from the different companies together, use a ‘subtotal’ function to aggregate the values and use the grouping feature in Excel to hide the detail.
Craig Juta, Excel Master
EXCEL TEMPLATE MANAGEMENT
August 29, 2010A templates is created by linking an Excel workbook to a SAI report. The advantages of creating this link include 1) retaining the development investment made into the workbook and 2) having an identified master Excel workbook used for a particular purpose.
Below are some commonly used features when working with templates:
- To access the template for the purpose of making changes, right click a report and select the ‘design’ option- this will open the template and allow any changes to be saved
- To access the template for the purpose of making changes, run the report, change the resulting template and link it back to the report
- To abandon the relationship between a report and its Excel template, right click the report and select ‘unlink template’ – this will leave the report unlinked to a template and when run will send the dataset to a new workbook
- To link a report to a previously linked template, select the report and then select the ‘…’ button to the right of the ‘Report Template’ text box and then select a template from those available
Craig Juta
GOOD SAI REPORT DESIGN – UNION REPORTS
August 26, 2010When assessing the quality of SAI report designs, the most salient characteristic that I seek to identify is the lack of ‘quantity’ and ‘complexity’. A report may meet complex business needs and may require a very large work effort but this complexity does not have to relayed to the user of the report.
A feature on SAI that compliments this concept, is the Union Reports feature. Union Reports make it possible to deliver multiple, disparate datasets to the Excel template.
To create a Union Report, include the following steps:
- Create multiple standard reports
- Right click on the folder in which the Union Report will reside
- Select ‘Union Report’ and the select the sub-reports from the list, that you would like to include
- In the properties of the Union Report, right click one of the sub-reports and select properties
- In the properties window, change the sheet index to which the dataset from this report should flow
Now when this Union Report is run, each sub-report will run consecutively, placing the respective datasets on each sheet.
Union Reports compliment the ‘Less is More’ concept by avoiding the need to use multiple Excel workbooks for reporting and providing the opportunity for a dashboard based on multiple, disparate data sources for business decision-making.
Craig Juta, SAI Consultant
WHY ARE SOME GL ACCOUNTS MISSING? – FINANCIAL PACK
August 24, 2010You might have run the Financial Pack in SAI and found that some GL accounts are missing.
The Financial Pack intentionally excludes GL accounts that have not been used during the current year or that do not have budgeted amounts against them.
To abandon this aggregate filter, in the report properties window of the ‘Trial Balance Sub’ report, select the ‘Aggregate Filters’ tab and remove the 2 filters that reside there. Now all available GL accounts will appear in the report template when run.

To access the ‘Trial Balance Sub’ report, refer to the blog post explaining Union Reports.
Craig Juta
REPORT PROPERTIES – FILTERS & PARAMETERS
August 24, 2010Filters and Parameters both serve the same purpose – limit the records delivered to the Excel template to those that meet the logical condition applied by the user.
Both have 3 steps for a basic setup from the filters/parameters tab – Click ‘Add’ -> select a field from the field list -> select the logical condition from the list -> type a value (in the case of a filter) and a default value (in the case of a parameter) for the logical condition to use (this value may be typed, selected (by hitting the ‘…’ button) or a system variable added (by hitting the ‘@’ button).
The difference is that the filter always uses the user-defined filter value and the parameter requests a value from the user each time the report runs.
Craig Juta
REPORT PROPERTIES – COLUMNS(FIELDS)
August 17, 2010In the properties window, within the columns tab, hit the ‘Add’ button to add columns to the list.
ADDING COLUMNS – The columns available to you are limited to those in the source container. To add columns (fields) to the source container so that additional columns are available in this window, the Connector module is required.

REMOVE A COLUMN – In the ‘columns’ tab, select the field to be deleted and select the ‘Remove’ button. This action removes the field from the report but retains it in the associated container found in the Connector module.
MOVE THE POSITION OF A COLUMN – A column can be moved by dragging and dropping or by selecting a column and clicking the ‘Move up’ or ‘Move down’ button to the right of the window. Moving the position of a column in the list also moves it in the position in which it is placed when the data is dumped into the Excel template.
COLUMN PROPERTIES – As per the screen shot below, an aggregate function may be applied to a field by right clicking on a field and selecting ‘properties’ and then selecting the aggregate function to apply as per below. Because agregation reurns less records, it is used when returning large datasets to Excel and the users of the report do not require much detail.
Note: Aggregation can only be applied to a ‘measure’ field which in turn groups the ‘dimension’ fields accordingly.

Intelligence – SAI training in Western Canada
REPORT PROPERTIES – COLUMNS
August 17, 2010The ‘columns’ tab in the properties of a standard report hosts the listof fields available to the report in the order and with the text as they appear in the Excel template once the report is run. These fields may be added to, deleted, shuffled around to display in a different order or have their individual properties set .
Please see the related posts that explore each of these acions in detail.
xlIntelligence SAI training
REPORT PROPERTIES – BASICS
August 17, 2010There are some common and some unique properties when dealing with Standard(blue) reports and Union(green) reports. Accessing the poperties of any report requires the ‘show advanced’ check box to be checked.
Circled below are the properties available to standard reports and not to Union reports:

Each of these properties and the Standard/Union report relationship are explored in other blog posts in this SAI blog.
bxInteligence – SAI solution provider
SHARING THE OUTPUT FILE WITH OTHERS
August 17, 2010The output of your report which is a populated Excel template may be published to a network location and shared with other network users who have MS Excel installed. To do this you must access th properties of the report. Accessing the properties of a locked report requires the report to be unlocked by making a copy of that report – simply copy the report and paste it to any existing folder in the SAI Report Manager. Now you may follow these 2 steps to share the output with others:
- check the ‘show advanced’ check box to view all report properties
- in the ‘generate output file’ text box, type or browse for the desired location of the output file


Now every time the report is run it will create a copy of the output template to the set location, over-writing any previous copy with the same name.
Craig Juta, SAI solution provider
SCHEDULE A REPORT TO RUN
August 16, 2010A report may be scheduled to run at a specific time using a combination of SAI functionality and the windows task scheduler. There are 2 ways to do this and we will explore 1 way in this session.
- Select the desired report, right click it and select the ‘Generate Schedule Command’ option
 2. If the report expects parameters to be entered, these will be requested from you and saved in the schedule command

3. The schedule command required by windows scheduler will be coppied to the clipboard and SAI will show this screen 4. Now invoke the windows scheduler – ‘Control Panel -> System and Security -> Administrative Tools -> Windows Scheduler
5. One of the entries in the scheduler is the ‘scheduler command’ which is currently on your clipboard and is required to be pasted in the appropriate textbox
The report will now be invoked by the scheduler at the chosen time and frequency. One of the drawbacks of scheduling reports is the hard-coded nature of the parameters entered for the report. There are a few tips and tricks to overcome this and I will be exploring these in future posts.
NOTES ON SCHEDULING:
To have access to the scheduler command in Sage Intelligence, the installation of Sage Intelligence must have at least two Report Manager licenses OR one Connector license. The recipients of a Scheduled report only require a valid license of MS Excel and not a Sag Intelligence license (unless they need to access Sage Intelligence Addins).
Normally the user will not be sitting in front of the machine running the scheduled report and it is therefore beneficial to apply 2 properties to the report (select the report and check the ‘show advanced’ checkbox’ to see report properties):

GenerateOutputFile
The 2 properties applied above are 1) Generate Output File which saves the template to a shared network location and 2) Close Book on Completion so that the open workbook does not linger on the machine that ran the report
Craig Juta
3 FINANCIAL REPORTS – WHICH ONE TO USE?
August 12, 2010Financial Report ‘D’ requires account groups to be mapped to a set of arbitrary account categories AND allows the user to drill down to the transactional records for an account within the Excel workbook
Financial Report ‘S’ requires account groups to be mapped to a set of arbitrary account categories AND invokes another report for the purpose of drilling down to the transactional records for an account, therefore requiring an active connection to Sage Accpac for this drill down to function
Financial Report ‘SB’ does NOT require account groups to be mapped but instead uses the account groups as they have been defined in Accpac AND invokes another report for the purpose of drilling down to the transactional records for an account, therefore requiring an active connection to Sage Accpac for this drill down to function

Sage Accpac Intelligence
WHY INVEST IN THE CONNECTOR MODULE?
August 12, 2010For those clients who have only one company set up in Accpac, only use the core modules of Accpac and have basic reporting needs, investing in the Connector module is a decision that can be deferred.
To customers who maintain multiple companies in Accpac, I say ‘when can a dynamic and consolidated view of operations and capital employment ever be a bad idea?’ and therefore the SAI Connector module is a good investment decision.
For customers using Sage CRM, Payroll and other add-on products the SAI Connector module just makes sense.
To customers using Project and Job Costing (PJC), I say it is a ‘no-brainer’ to make that investment considering the unlimited creativity that can be applied to PJC reporting using the Connector module.
It consolidates data from various sources, grants access to data not available in the standard set of SAI reports and only one license is required per site regardless of how many Report Manager or Viewer licenses exist. For all decision-makers who have Sage Accpac as their ERP, if you have an inclination to using consolidated, dynamic reports to provide you with objective decision-making tools then I suggest – invest in the SAI Connector module.
Craig Juta
Converting the sign of a range of numbers
August 12, 2010When needing to change the sign of a range of numbers from negative to positive or vice versa, the following tip is one way to go about this.
- place a negative one (-1) in any cell and copy that cell
- with the copied cell on the clip board, select the range of cells to be changed (the range might be non-contiguous in which case you may select these while depressing the ‘control’ key) and then select paste special -> multiply
This procedure multiplies the entire range by the number on the clip board which may present you with some other creative uses hereof too.
Craig Juta, Sage Accpac Intelligence consultant
MOVING FORMULAE BETWEEN WORKBOOKS
August 12, 2010When moving worksheets or ranges of cells containing formulae between workbooks, the formulae that reference other worksheets will retain their links to the original workbook. In some cases this might be desirable but when it is not intended there are at least 2 ways to avoid this link to the original workbook.
- Before moving the worksheet/range, ‘find and replace’, all ‘=’ signs with a symbol that may be reversed back to the ‘=’ sign in the destination workbook. As an example, ‘find and replace’ all ‘=’ with ‘#’, move the worksheet/range and then reverse this by replacing all ‘#’ with ‘=’ in the destination workook.
- Move the worksheet/range as it is and in the destination sheet select edit -> links -> change source and then browse to the location of the destination file and select it. This will change the formulae to look at the objects within the destination workbook.
Craig Juta, Sage Accpac Intelligence consultant
GOOD DESIGN – WORKSHEET MANAGEMENT
August 11, 2010Workbooks have a habit of growing over time as the reporting needs of an organization evolve. As this occurs it becomes increasingly important to limit the visible worksheets to those relevant for a particular reporting purpose or to those sheets most often used.
A logical seperation is between sheets that contain the data to be referenced (source sheets) and the sheets that contain interactive formulae referencing the data on the source sheets. In the example below, I have used this code to hide all the sheets containing source data whenever a user opens the workbook.
Private Sub Workbook_Open()
Dim sht As Worksheet
For Each sht In ThisWorkbook.Sheets
If sht.Name Like “*data” Then
sht.Visible = False
End If
Next sht
End Sub
GOOD DESIGN – FORMULAE NOTES
August 11, 2010When including complex formulae in your report design, it is often prudent to provide notes to those formulae when trying to decifer them at a later time or for the sake of other users of the spreadsheet.
To do this you may make use of the ‘N’ function which converts a text string to the number zero. In this way you can add the result of your ‘N’ function to the rest of your formula without affecting the desired formula result.
Example:
= sumif (RngPer, A$1, Rng_Km) /countif(RngPer, A$1) + N(” Returns the avg mileage per period for each active truck”)
Craig Juta, Excel Trainer, Western Canada
Advanced MS Excel Training for SAI
August 11, 2010To achieve the most dynamic and maintenance free report design possible with Sage Intelligence it is important to consider the following:
- Apply the 80/20 rule to planning and executing of the report development
- Remember that it is critical to successful reports that you understand the function of SAI and MS Excel respectively in the planning and development process
- The success of your reporting projects depend heavily on your confidence in building MS Excel based solutions
Please browse through this blog for current and future MS Excel and SAI tips and tricks
Craig Juta has been an advanced MS Excel and SAI trainer for most of his career with a focus on empowering his clients in building sustainable MS Excel based Business Intelligence solutions.
Craig Juta now presents MS Excel Training courses throughout western Canada, focusing on enabling the users of Sage Intelligence to maximize the benefit of MS Excel and Sage Intelligence to their businesses.
Craig Juta is based in Edmonton, Alberta
AMENDING STANDARD REPORTS – TEMPLATES
August 11, 2010Once a copy has been made of a standard locked report, the MS Excel template linked to that report can be modified.
The relationship between the Excel template and the report is a one-to-one relationship and a template may be linked to or unlinked from a report .
There are at least 2 advantages to having this report-template relationship:
1) The master Excel template used for a particular reporting output is kept in one place, avoiding the need for template version control
2) Any investment into an Excel template’s structural changes are retained because the most recently changed template may be linked to the report to be populated when it is run
To link a template to a report, right click the report and select ‘create and link template’ from the short cut menu. Templates linked to a report are stored in the BXData folder in the Sage Accpac root directory.
A template already linked to a report may be changed without engaging in the linking process. This can be done by right clicking a report and selecting ‘design’ from the short cut menu which will open the template and allow any changes made, to be saved.
Craig Juta, Alberta Canada
Sage Intelligence Expert
AMENDING STANDARD REPORTS – PROPERTIES
August 10, 2010All the standard reports that ship with SAI are locked for editing. The need to edit reports arises from the following subset of needs:
– changing the features of a particular MS Excel template and linking this template back o the report to retain those changes for the next time that report is run
– changing the properties of reports, including the fields required, filtering, adding parameters to a report, attaching add-ins and macros to a report, saving the report to a particular network location, etc.
To create an ‘unlocked’ copy of a standard report, right click a report and select copy and then right click on an existing folder to paste the report into that folder. This report is a copy of the original report and includes a copy of the original template linked to this report. The user can now make full use of the report writing capabilities of the Report Manager to amend this report and template for the purpose of delivering the right information to the right people at the right time.
Craig Juta, SAI specialist
ALTERNATIVE TO ACQUIRING THE 'ANALYSIS' MODULE
August 10, 2010The SAI Analysis module supports the creation of Microsoft local cube files or .cub files off any ODBC compliant datasource. However, SAI also supports the ability to connect into existing Microsoft SQL Analysis Services Cubes.
-Launch the Connector module and browse to the very last connection in the listing called Microsoft OLE DB Provider for OLAP Services.
-Right click on this connection, and choose Add a new connection, and give it a name.
-Fill in your properties regarding the OLAP server i.e. name, database name, credentials
-Right click on this connection and select “Check test” to confirm that you have a valid connection.
-Right click on this connection and choose add a data container, and you should be provided with the existing list of OLAP data cubes in your server for selection.\
-Now launch the report manager and select “Add Report” and choose “Cube Report” and select the relevant OLAP cube data container from the Connector module that you just made available in the Connector module.
-Accpac Intelligence uses Microsoft Excel pivot tables as the default cube browser
-The advantage of this offering is that your customers can have a seamless and consistent experience for running all their reports whether they be direct from source or via OLAP data cubes.
-The above process, eliminates the need to have the SAI Analysis module, as you are connecting to pre-created OLAP cubes. Should you need to create the data cubes yourself, the Analysis module is used to define and create dimensions and measures for your cubes, and build them seamlessly.
SAI BACKUP PROCEDURE
August 10, 2010Only the BXDATA folder (found in the Sage Accpac root directory) needs to be backed up as this stores all the Pervasive and/or SQL Excel report templates as well as the Alchemex.svd file, which contains all the report and connection properties that relate to the installation.
To use the standard SAI backup facility, from within the Connector or Report Manager, click on File in the menu > Back up Metadata & Templates and choose a file name for your backup. SAI will create a .cab file (compressed file) that consists of all your SAI Excel report templates and metadata (alchemex.svd) which is required to restore your SAI installation to its former state.
To restore your SAI installation to its former state, reinstall SAI from the DVD, and extract the contents of your backup file (*.cab) to the SAI BXDATA folder, typically found in C:\Sage Software\Sage Accpac\BXDATA
LANPACK USAGE
August 10, 2010Sage Accpac Intelligence can be used without consuming a Lanpack license. This may be done by launching Sage Accpac Intelligence from the Start Menu while Sage Accpac is closed
Accpac consumes a Lanpak when you logon to the Accpac desktop, so if you have a Sage Accpac Intelligence license, you can access the module to run reports. Should all Accpac lanpaks be consumed, users that are assigned Accpac Intelligence licenses can launch the BI module from outside of Accpac and create, edit and run reports.
BASIC DEPLOYMENT APPROACH
August 10, 2010Following are the basic steps in the installation and deployment of SAI for the use of the 1 complimentary Report Manager license (the detail of each item will be explored in future blog posts and Intelliwidgets):
-Appropriate SAI modules check box checked upon installation
-Activate SAI in Administrative Services and allocate a license to a particular user, using the SAI ‘License Manager’ module (this links the license to the user).
-Then fire up the Report Manager on the workstation on which the license will be used (this action links the license to this workstation)
-Set up a security group for Sage Accpac Intelligence and then assign this group to Sage Accpac Intelligence for the appropriate user in the ‘User Authorisations’ window
-Set up security roles in the SAI ‘Security Manager’ (optional)
You are now ready to run reports using the Report Manager
LIMITATIONS OF THE COMPLIMENTARY REPORT MANAGER LICENSE
August 10, 2010It is important to clearly understand the limitations of the 1 complimentary report manager license that ships with Sage Accpac v5.6.
-It does NOT allow the user to setup multi-company consolidated reporting
-It does NOT allow reports to be imported (this requires the acquisition of either a ‘Connector’ license or 1 additional ‘Report Manager’ license)
-It does NOT allow the user to access fields other than those predefined in the standard report containers
PJC STANDARD REPORTS
August 10, 2010As at today there are no standard SAI reports for Project and Job Costing (PJC) and clients with a need for SAI reports for PJC will need to consult with an SAI expert to develop such reports.
Remember that the development of PJC reports requires a ‘Connector’ license because the SAI container objects required for such reports do not ship standard with Accpac v5.6.
OPERATIONS SUITE REQUIRED FOR SOME STANDARD REPORTS
August 10, 2010Any report depending on the Sage Accpac Purchase Order, Order Entry or Inventory Control modules will return an error when trying to run such a report.
The standard reports included in this category include: ‘Dashboard Analysis’, ‘Inventory Master’, ‘Sales Master’ and ‘Purchase Master’.
In the case where these modules are absent, there are standard reports that can be run that depend on the General Ledger module.
The standard reports included in this category include: ‘Financial Reports’, ‘Financial Trend Analysis’ and ‘General Ledger Transaction Details’

